As applications and their associated databases grow, things change. Rows get modified, schema get updated, and often, things can slow down. These performance hits may come up suddenly, or maybe intermittent, but it's important to know how to distinguish what is going on so that you can go about fixing it.
There are so many factors that can contribute to performance issues in the SQL world, it can be downright baffling where to even begin. The post is going to delve into some of the steps that you can take when your database is acting silly, so that you can diagnose exactly what is going wrong and focus on speeding things up.
Is it the Database? Or the Server?
One of the first things to check when a query is running sluggishly isn't actually the database itself, but rather possible issues with the server that it's running on.

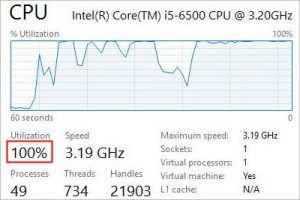
If you have access to the server, you might consider using a tool like System Monitor or Perfmon to look at the processes that are running on the server itself. High memory usage, high CPU usage, and slow network traffic are all red flags that the issue may not be the database itself.
There are plenty of other system diagnostics tools out there that can help with this process, but one of these should at least point you in the right direction before you spend countless hours staring at tables, indexes, and more.
Profiling and Reporting to the Rescue!

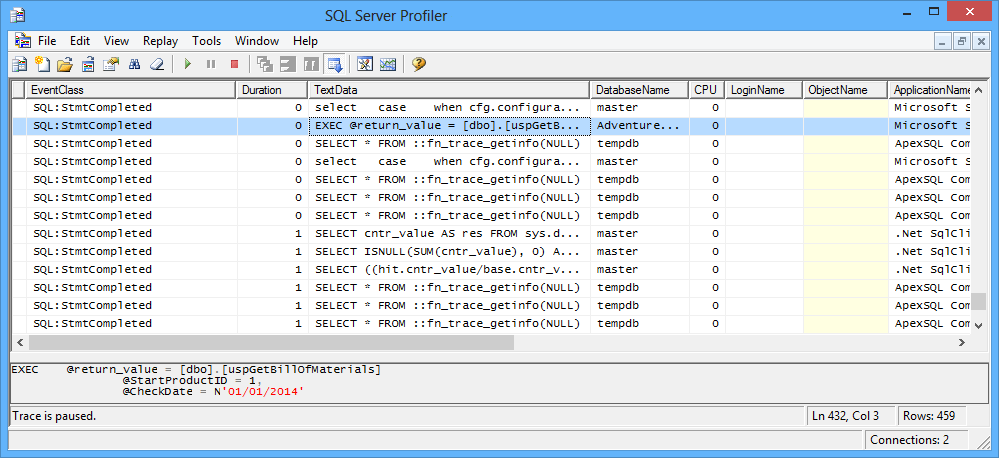
SQL Server has a great profiling tool that can be great for both troubleshooting existing issues and isolating slow running queries. It's also a fantastic way to get some additional data about your database for performance tuning purposes (i.e. see which queries are being executed most frequently, look at things like memory and CPU usage, identify potential blocks, etc.
A few things that you should look for here:
- Long-running queries - Look for any queries that might jump out as outliers from the rest of your calls could be indicators that something may not be working as intended.
- CPU intensive queries - Look for any queries that may be pegging the CPU, which could be issues on the machine itself, poorly written queries, or a combination of things.
- Check for Deadlocks - Look for any mentions of the term "Lock", which might indicate that two or more transactions are causing a deadlock. When this occurs, you can dig further into it by finding those that mention "Deadlock Chain", which indicates they are events that lead to the deadlock.
The profiler is infinitely useful and a great first step into diagnosing poor performance (or bugs in general), and it's useful in both development and production environments (since it can remotely target an existing database).
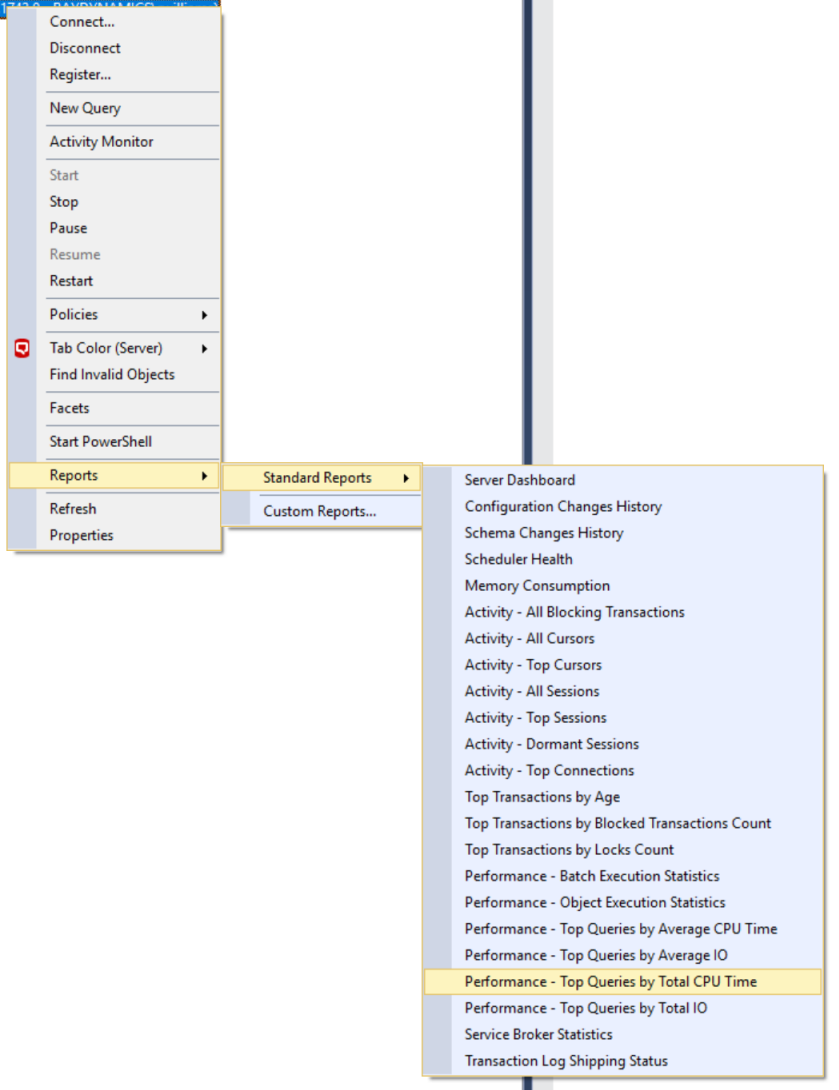
Additionally, if you know something like CPU is your bottleneck, you can take advantage of pre-built performance queries to attempt to isolate a specific query or queries that might be causing your issues:
These various performance related queries can be worth reviewing periodically to find potential issues that may creep up over time.
Found the culprit? Now figure out why it's slow.
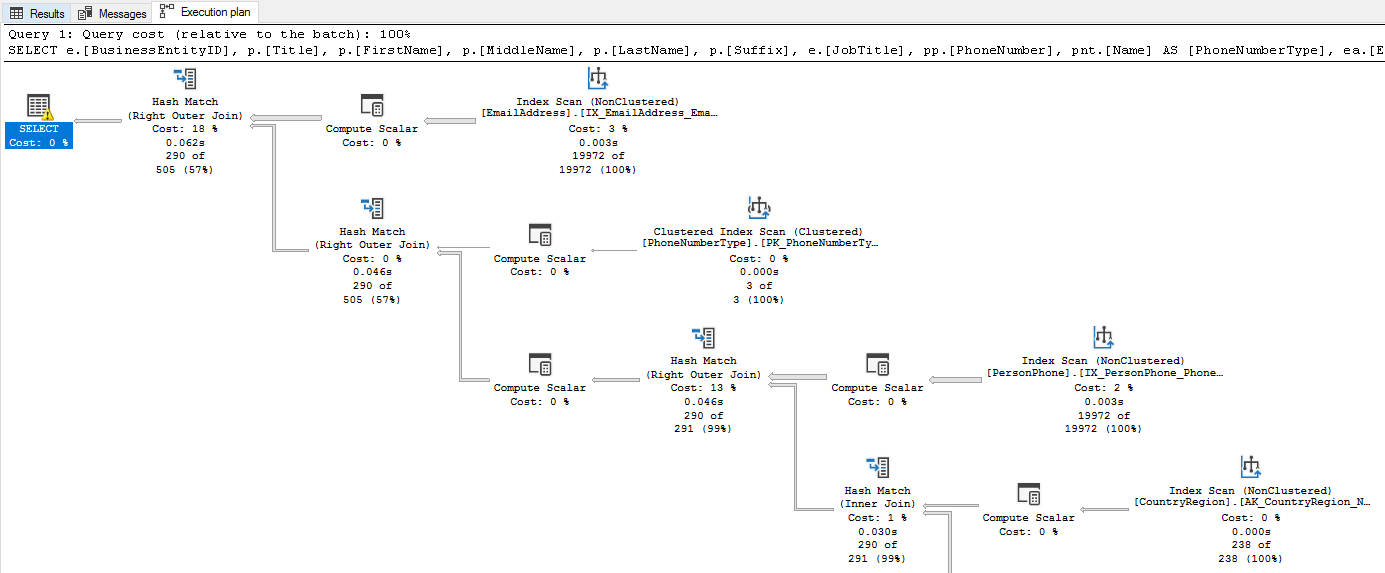
Once you've identified a particular query that is running slowly within the profiler, you can view the execution plan for it to see exactly what SQL Server is doing behind the scenes. You can easily access this from a given query via the Ctrl+M shortcut, the "Include Actual Execution Plan" button on the toolbar, or from the Query menu:

Execution plans can easily reveal potential issues related to indexing and any non-SARGable queries that might be taking place, which are causing your entire table to be scanned as opposed to seeking exactly what it needs. At first, they may seem incredibly complex (and they can be), but once you have worked with them, you'll learn to identify patterns and what they are associated with (e.g. X operation indicates a missing index on a table, etc.)
A few things to look for here:
- Look for Warnings - Warnings like "No Join Predicate" should be very apparent red-flags that you'll likely need to address. Most warnings should warrant further investigation at the very least.
- Order of Operations (Costs) - Consider ordering the most costly operations and determine if those make sense. Is a simple join using up 90% of the compute for the entire call? If so, something might be wrong.
- Scans vs. Seeks - Neither of these are necessarily bad, but if one is taking much longer than expected (either one), it's probably worth determining if you are missing an index (i.e. SQL Server is scanning the entire table instead of just grabbing a well-defined lookup value).
Understanding execution plans comes with experience, and hopefully, you don't have to delve into them too frequently. But if you do, know they can be a valuable ally in the fight against bad performance.
Investigate Potential Bad/Missing Indices
SQL indexes are the bread and butter of performance tuning within your database. You can think of them much like the indexes you might find within a book, as they'll allow SQL to "know" where to go looking for a particular piece of data instead of arbitrarily thumbing through page after page.
It's worth noting that indexes aren't "free" and as with most things, if you use them incorrectly, they can do more harm than good (i.e. imagine going on a scavenger hunt with extraordinary vague or crappy hints).
One great thing is that you don't always have to do all of this grunt work yourself. Folks like Brent Ozar have built scripts like spBlitzIndex that you can run against your database to recommend indexes based on table usage, etc. A few other tools like the following can be useful as well:
In general, Brent's blog is a treasure-trove of knowledge on SQL Server performance, troubleshooting, and much, much more. I highly recommend bookmarking it if you live in the SQL world (or even dabble in it).
Lies, Damn Lies, and Statistics.
As much as it can be valuable to know how to optimize SQL queries, it's worth noting that SQL Server does some of this on its own for better or worse. It accomplishes this through the use of statistics by monitoring calls that are being made, caching execution plans, and making judgements on how a given call could/should be best executed.

Notice I mentioned "for better or worse" and that's intentional. While statistics are incredibly valuable, they can also create problems if they aren't being gathered correctly or they are stale. In most scenarios, you probably won't have to dig into these with any kind of regularity, but it's important to know that they exist.
I highly recommend visiting the Microsoft documentation on SQL Server statistics to learn a bit more about them, how to update them, and more.
Use Your Eyes (or Someone Else's)
If the ill-performing query in question is something that has been untouched for a long period of time, you might want to run a "fresh" set of eyes on it. Look for any noticeably slow operations (e.g. wildcard searches, large aggregation calls, etc.) that could turn those seeks into scans.

Additionally, you might consider if you are using a more recent version of SQL Server than the query was originally written to target to see if any new features might be more efficient to perform your operations.
Other Common Scenarios
A few other things that you might look into that might be considered "edge cases" would be things like:
- Sharding/Partitioning - For extremely large databases, you might consider an approach like sharding or partitioning your databases.
- Leveraging Views - In some cases, the use of a SQL View can help make your queries much more readable and allow you to identify potential issues in a smaller wall of text.
- Distributed Transactions - Distributed programming is hard, and if you are doing anything crazy such as making connections to remote databases via Linked Servers, this could present challenges on both sides of the equation.
As with just about every other branch of technologies, it’s very unlikely that just one of these items will cure all of your performance ailments. Consider all of these to be valuable tools within your troubleshooting arsenal and use them in conjunction when trouble arises.
