As a web developer, I absolutely could not live without great in-browser developer tools. I use them every day, and they can certainly make your life much easier. Typically my browser of choice is Chrome, so I thought I would take some time to introduce a few new features in the latest release that are really, really cool.
So Google Chrome's latest version (59) had quite a few new features that are worth mentioning and that I'll briefly review within this post:
- Explicit Request Blocking
- CSS and Javascript Code Coverage
- Full Page Screenshots
- Async Await Step Over
Explicit Request Blocking
Troubleshooting unknown or unexpected scenarios can be tough to do sometimes. Simulating if your CDN is down, or if a given resource simply fails to load can be done, but this latest Chrome feature makes it much, much easier.
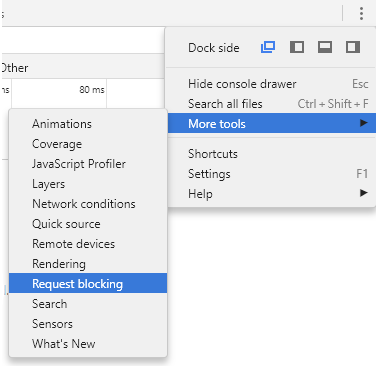
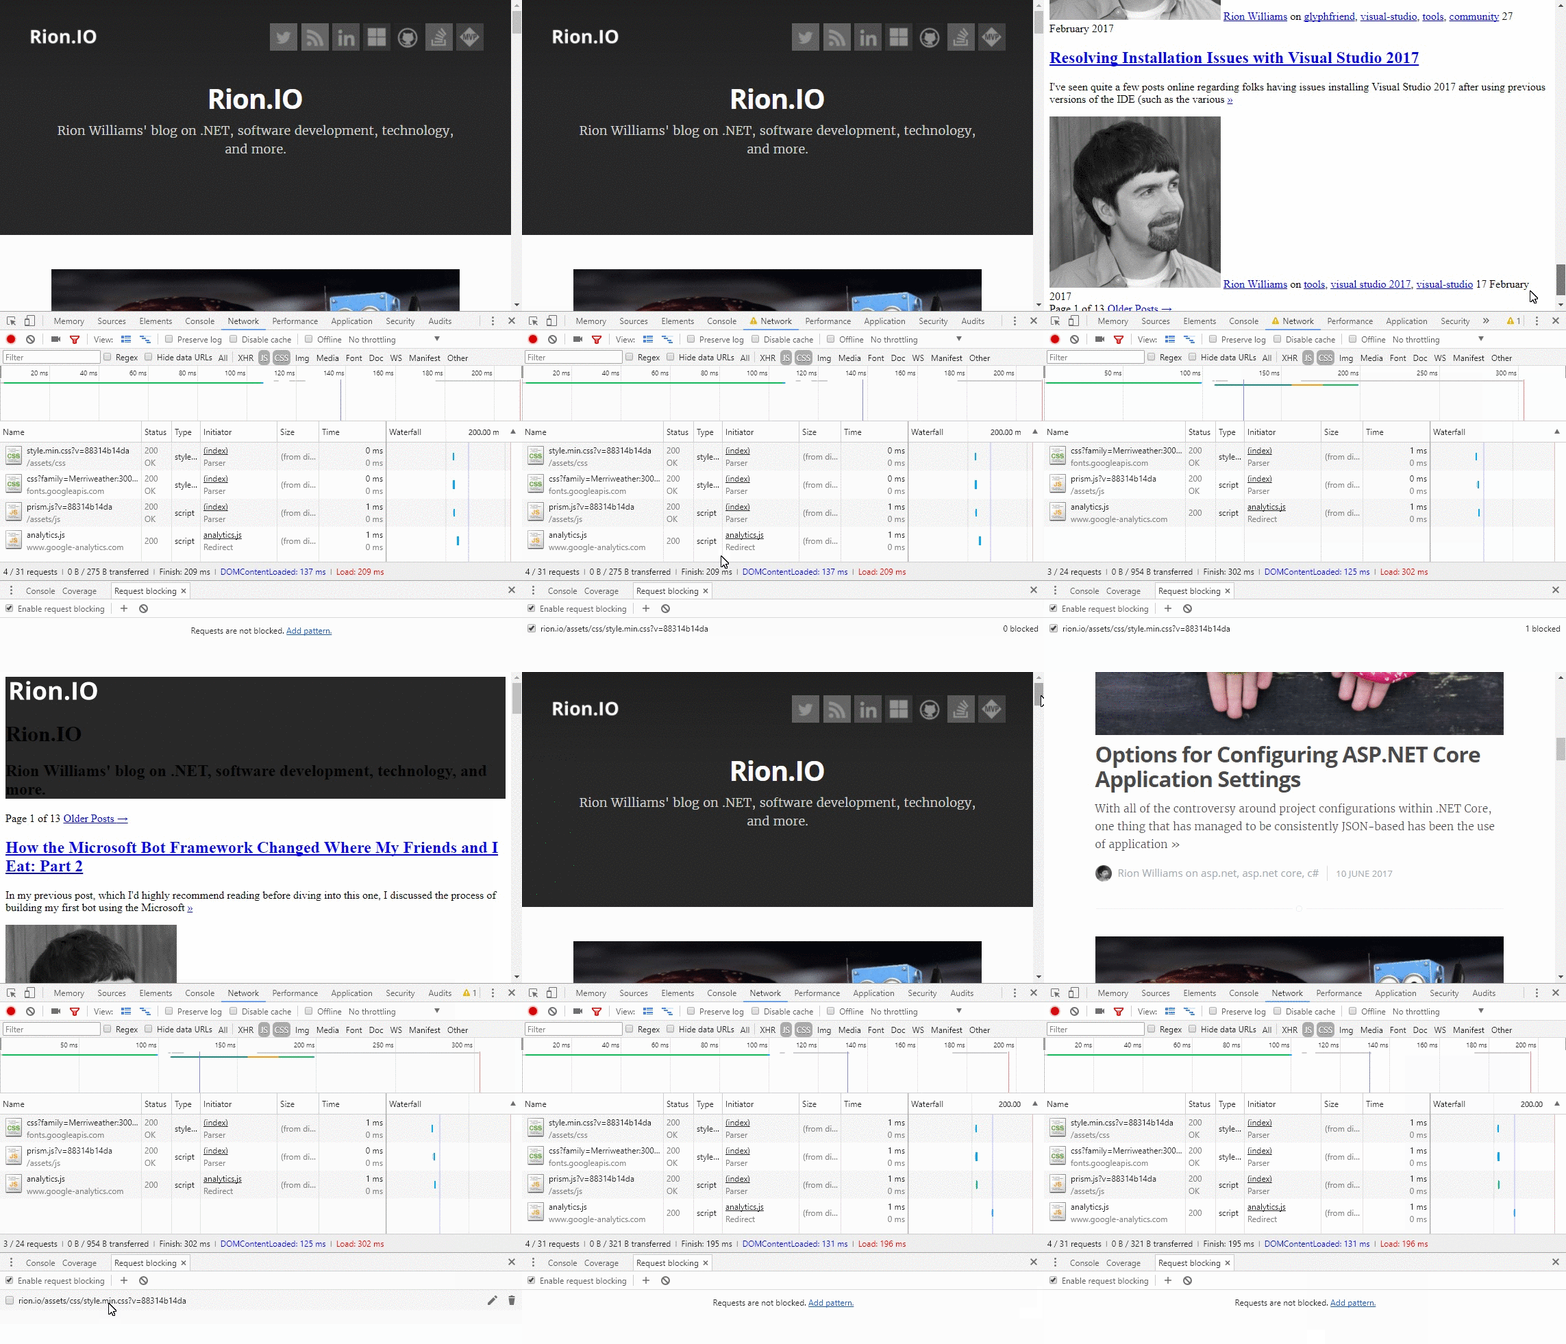
Chrome now allows you to simply block a request from resolving, allowing your specific fallback logic to kick into gear and see how your site reacts. This feature can be set up two ways by either explicitly defining some patterns to determine which requests to block using Menu > More Tools > Request Blocking:
Or by simply right-clicking a particular request that you want to disallow in the Network menu and choosing the 'Block Request' option:
CSS and Javascript Code Coverage
As developers, we are should always be striving to be better and in the realm of web applications, this typically means getting the client what they need as fast (and efficiently) as we can.
Generally you can use techniques like minification and bundling to help reduce the overall size of the resources that you are sending down the pipe. But what if you didn't even need all of them? What if you had a way to determine exactly which CSS selectors that a given page was using or which functions were being called on a specific page? Well with the CSS and Javascript Code Coverage feature, you do!
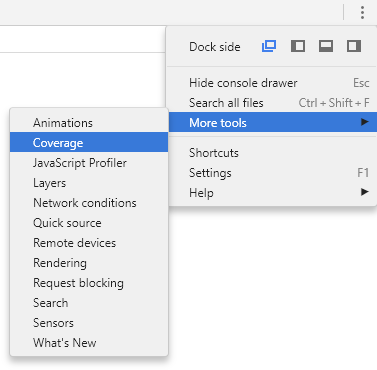
To take advantage of this, you'll need to explicitly enable the Coverage tab by clicking on the Ellipsis menu, choosing More Tools and selecting Coverage:
Now when you open up your Developer Tools on a page, Chrome will now show you what percentage of the code within that file is actually being used:
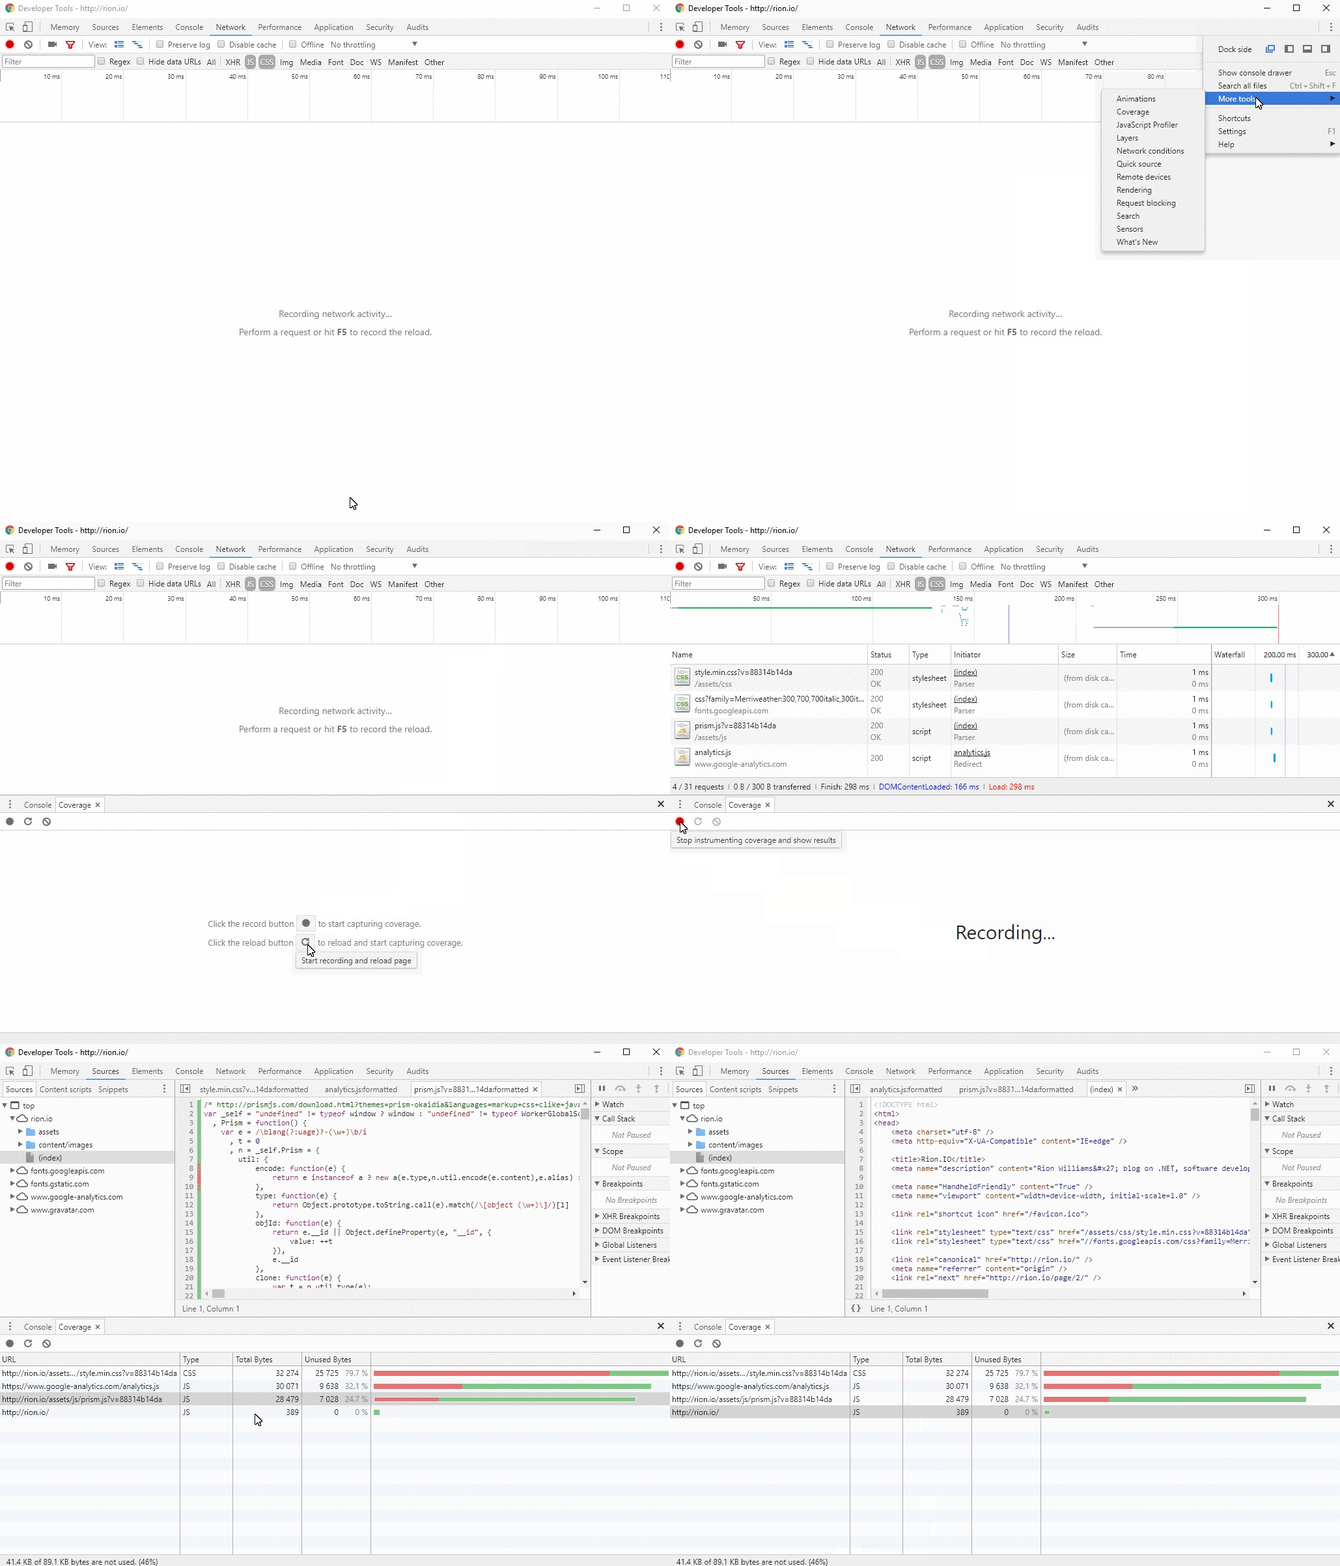
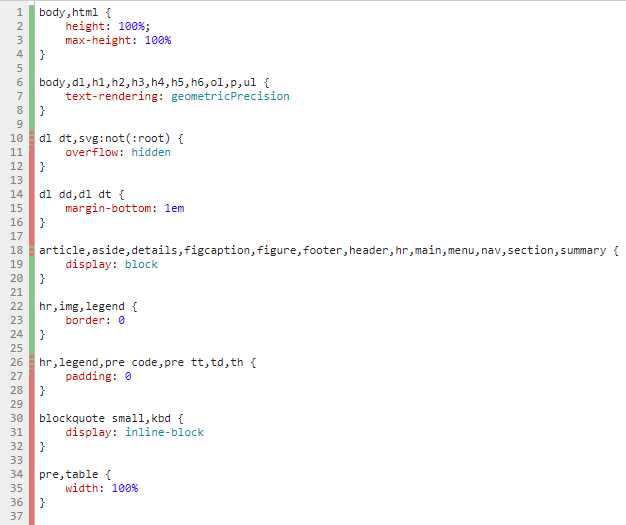
Finally on top of that, you can click on a specific file within the Coverage tab and it'll show you exactly which lines are and aren't being used within your site:
This can be extremely useful in some scenarios as it will allow you to fine tune your resources ensure that you aren't wasting precious bytes by sending down things that you don't need. Now this may not always be the case, but it's certainly an area that you can look to improve.
Full Page Screenshots
If you've ever had the need to reproduce a visual issue with a site, or you might want to make several changes to one and simply needed a mock up to draw on: this one might be for you.
While using the Snipping Tool to continually take a snapshot of a site, scroll a bit more, take another, and then piece those altogether using Paint can work - it usually ends up looking like a horrible mess. Thankfully, Chrome can now automatically take a full-page screenshot of your current viewport using the Device Emulation settings.
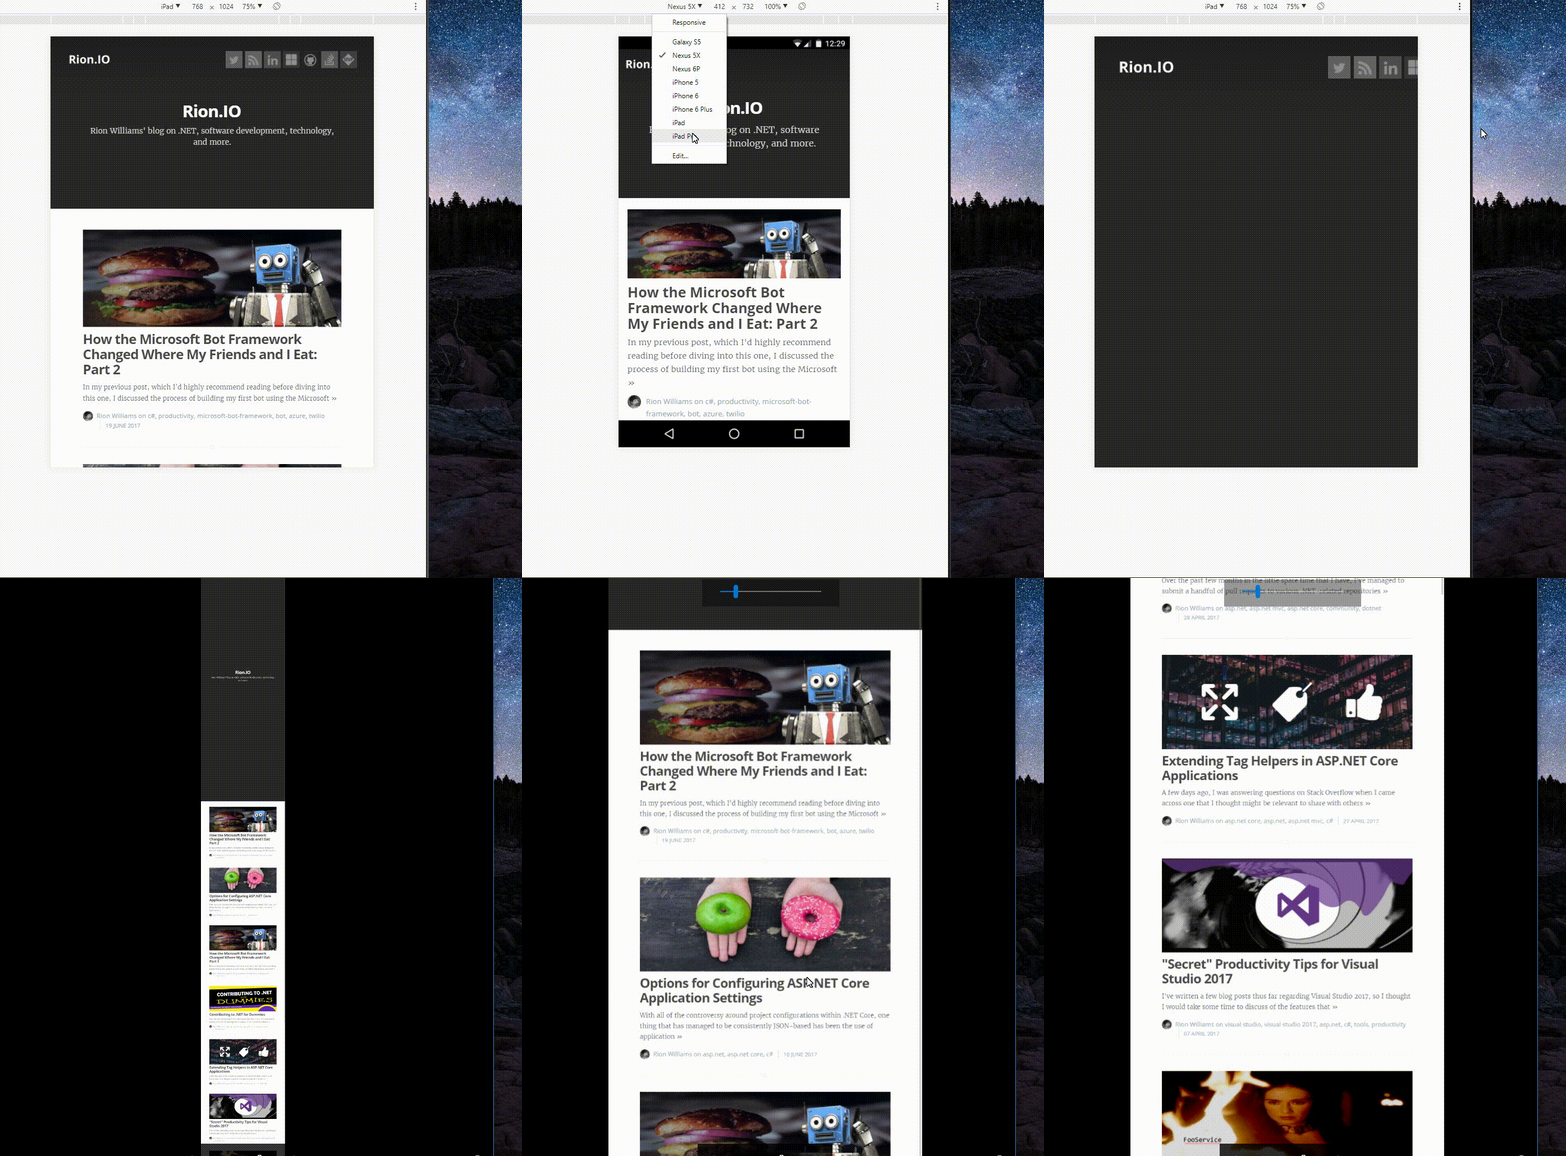
To enable this feature, you will need to use Chrome's Built-In Device Emulator which can be found by clicking the mobile icons within the Developer Tools:
Now, you should see a slightly different version of your site along with a variety of different filters to emulate different devices. Simply choose the device you want to screenshot using, and choose the Capture Full Page Screenshot option from the ellipsis menu:
Async Await Step Over
Asynchrony is complicated, and debugging asynchronous snippets of code can really be a nightmare if your tooling isn't there to help you out. Consider you had a section of code like the following:
function wait(ms) {
  return new Promise(r => setTimeout(r, ms)).then(() => "Yay");
}

// do some work in background.
setInterval(() => 42, 200);

async function test() {
  debugger;
  const hello = "world";
  const response = await fetch('index.html');
  const tmp = await wait(1000);
  console.log(tmp);
  return hello;
}

async function runTest() {
  let result = await test();
  console.log(result);
}
In the past, you would be in the middle of stepping through the test() function when your setInterval() code decides to throw and wrench in your debugging and wants your attention. Chrome will now step through from the first line to the last line, despite any other asynchronous calls that are executing consistently, making debugging your async operations and promises much, much smoother.
Wrapping Up
Hopefully from these four features, there may have been at least one that might make its way into your daily (or weekly) repertoire. If not, then when the day comes that you need to do anything resembling the following:
- Performance tweaking and ensuring no byte goes unused.
- Ensuring that your async code is working as expected.
- Checking if your site can survive a massive CDN outage without looking like crap.
- Get Pam from marketing that huge screenshot of the site to draw on.
You can be confident that there's a tool to do in your browser and it's just a few clicks away.
